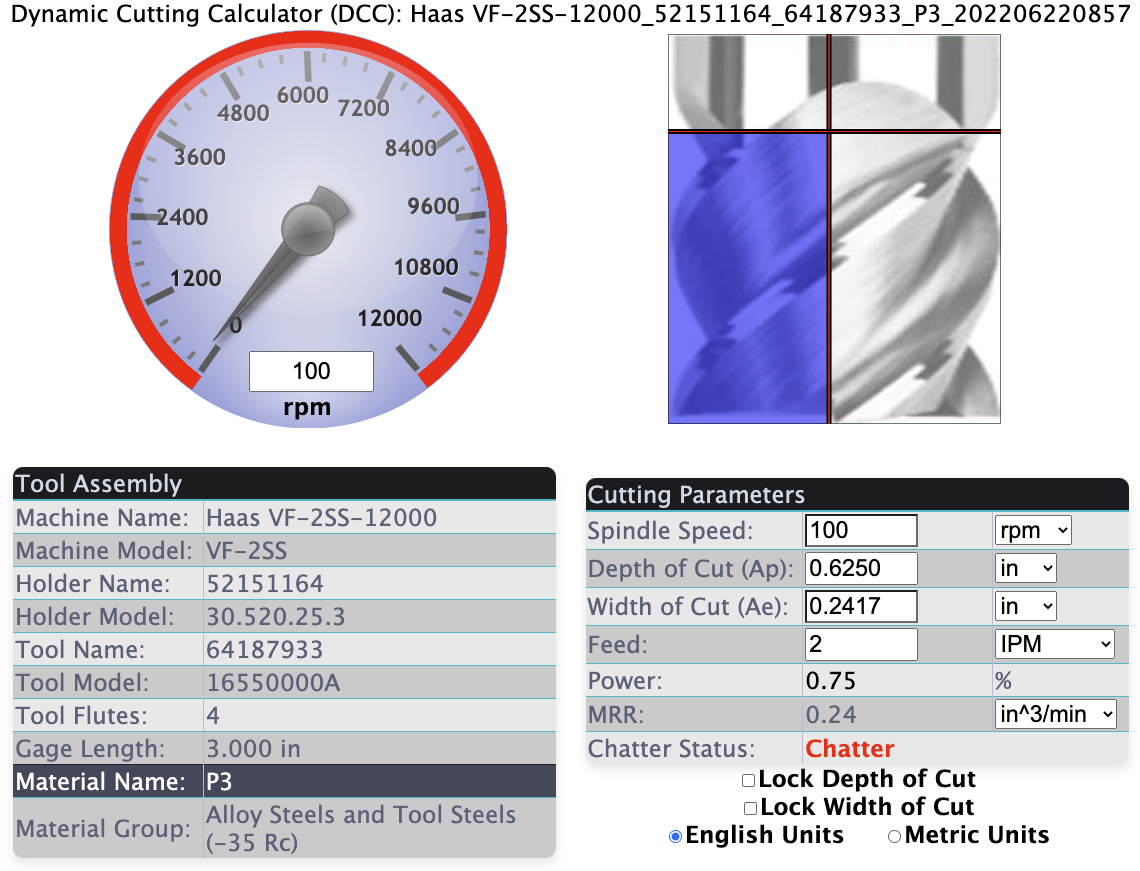
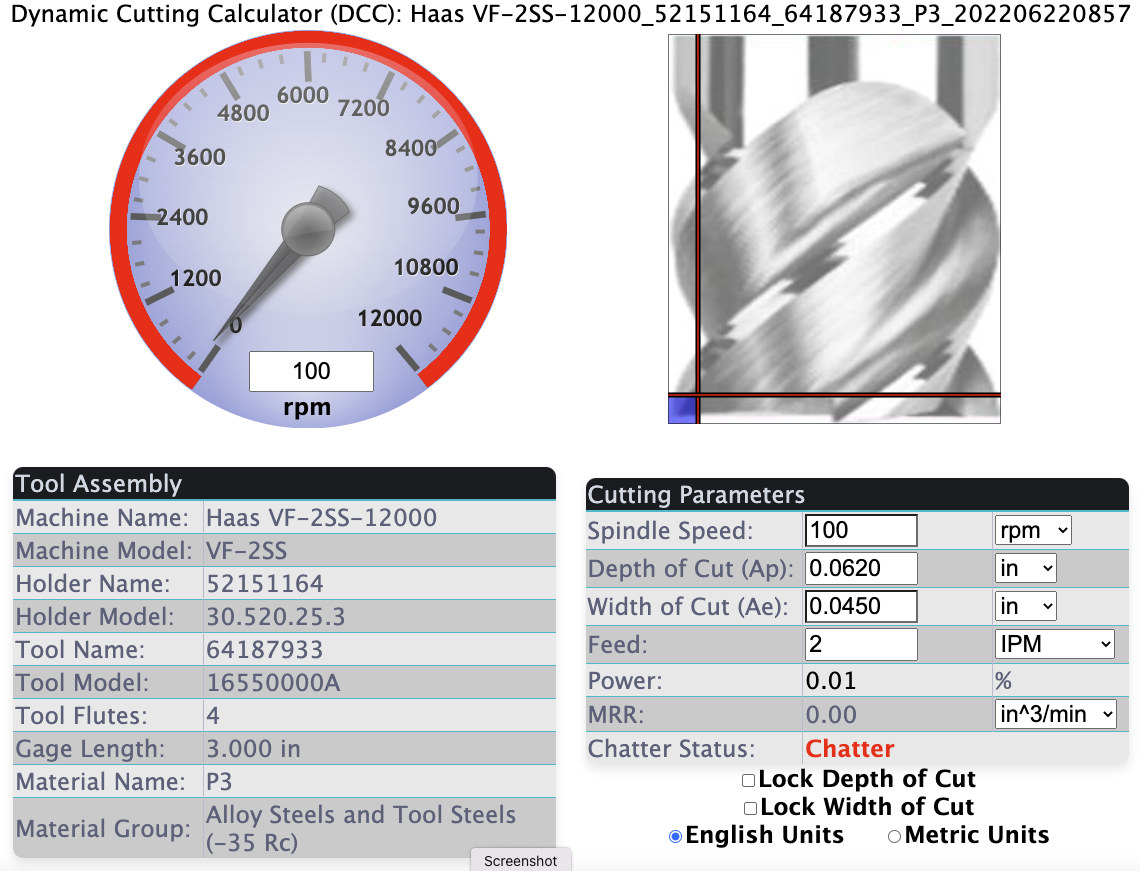
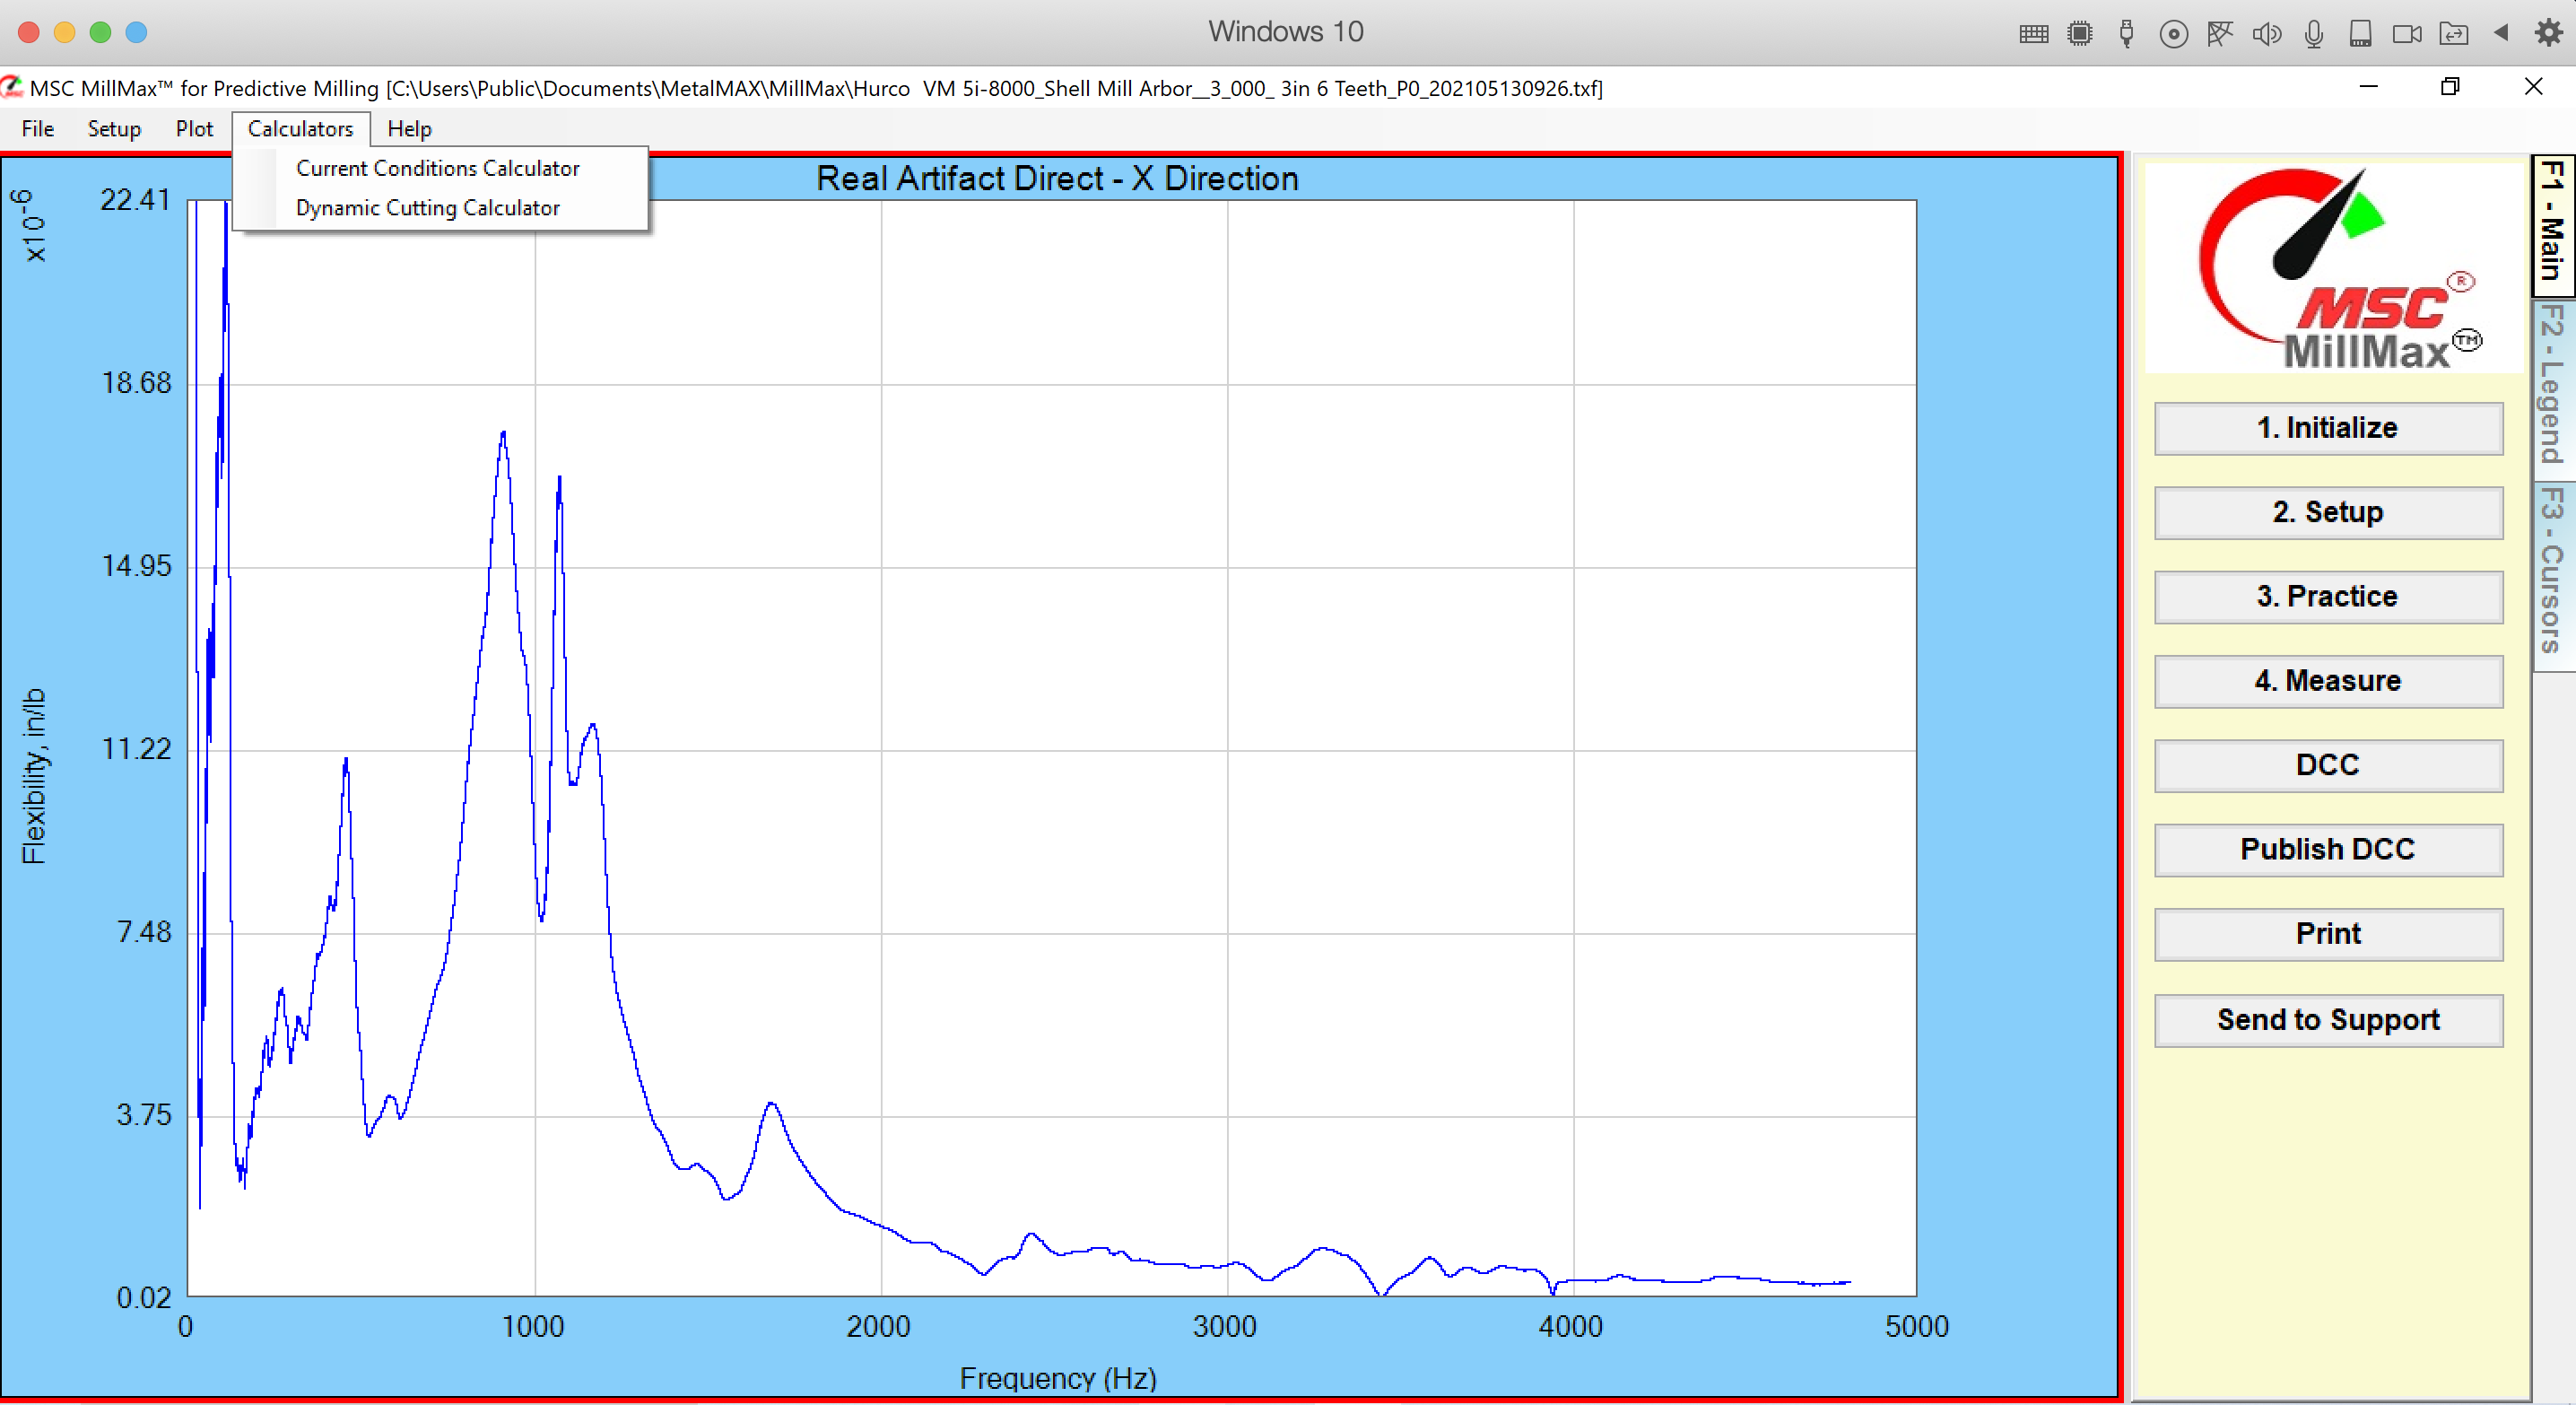
add-circle-bold add-circle add-square add alarm-bell-1 alert-diamond analytics-pie-2 archive archive arrow-down-1 arrow-down-2 arrow-left-1 arrow-right-1 arrow-up-1 attachment-1 bin-paper-1 book-star button-record check-1 check-circle-1 close close-quote close cog-1 cog common-file-stack copy-paste credit-card-1 diagram-fall-down disable time-clock-midnight download-thick-bottom drawer-send envelope-letter envelope-letter expand-6 expand-6 file-code filter-1 floppy-disk flying-insect-honey folder-file-1 headphones-customer-support hierarchy-9 hyperlink-2 information-circle keyboard-arrow-down keyboard-arrow-up layout-module-1 list-bullets lock-2 lock-unlock-1 love-it messages-bubble-square move-to-top multiple-circle multiple-neutral-1 multiple-users-1 navigation-menu-horizontal navigation-menu network-browser open-quote pencil-1 pencil-write pencil-1 print-text rating-star rating-star remove-circle remove-square-1 search send-email-1 shield-warning single-neutral-actions single-neutral smiley-sad-1 smiley-unhappy smiley-indifferent smiley-smile-1_1 smiley-happy smiley-sad-1 smiley-unhappy smiley-indifferent smiley-happy smiley-thrilled social-media-twitter synchronize-arrows-1 tags-double ticket-1 ticket-1 time-clock-circle undo view-1 view-off view wench

Common cause of an all red Dashboard

Here is a Training Lesson on dealing with an all red Dashboard:

https://millmaxtraining.s3.us-west-2.amazonaws.com/All+Red+Dashboard+-+Presenter+output/presentation.html 


You have an all red Dashboard
Lower the width and depth of cut. If NO green or yellow zones appear at all, reopen the file in MillMax.
This shape of graph (or no graph at all) indicates that no measurement is present. You may have an older file that contains the measurement. If you reload the data, open that file and tap-test a new file will be created. The original file you entered the data will not have the tap-test measurement.
A measurement will have a non-uniform graph.