add-circle-bold add-circle add-square add alarm-bell-1 alert-diamond analytics-pie-2 archive archive arrow-down-1 arrow-down-2 arrow-left-1 arrow-right-1 arrow-up-1 attachment-1 bin-paper-1 book-star button-record check-1 check-circle-1 close close-quote close cog-1 cog common-file-stack copy-paste credit-card-1 diagram-fall-down disable time-clock-midnight download-thick-bottom drawer-send envelope-letter envelope-letter expand-6 expand-6 file-code filter-1 floppy-disk flying-insect-honey folder-file-1 headphones-customer-support hierarchy-9 hyperlink-2 information-circle keyboard-arrow-down keyboard-arrow-up layout-module-1 list-bullets lock-2 lock-unlock-1 love-it messages-bubble-square move-to-top multiple-circle multiple-neutral-1 multiple-users-1 navigation-menu-horizontal navigation-menu network-browser open-quote pencil-1 pencil-write pencil-1 print-text rating-star rating-star remove-circle remove-square-1 search send-email-1 shield-warning single-neutral-actions single-neutral smiley-sad-1 smiley-unhappy smiley-indifferent smiley-smile-1_1 smiley-happy smiley-sad-1 smiley-unhappy smiley-indifferent smiley-happy smiley-thrilled social-media-twitter synchronize-arrows-1 tags-double ticket-1 ticket-1 time-clock-circle undo view-1 view-off view wench

Setting Starting Values of Dashboards

You may want to have the Dashboard open to:

  1. The customer's current parameters.
  2. The optimized parameters you have chosen.

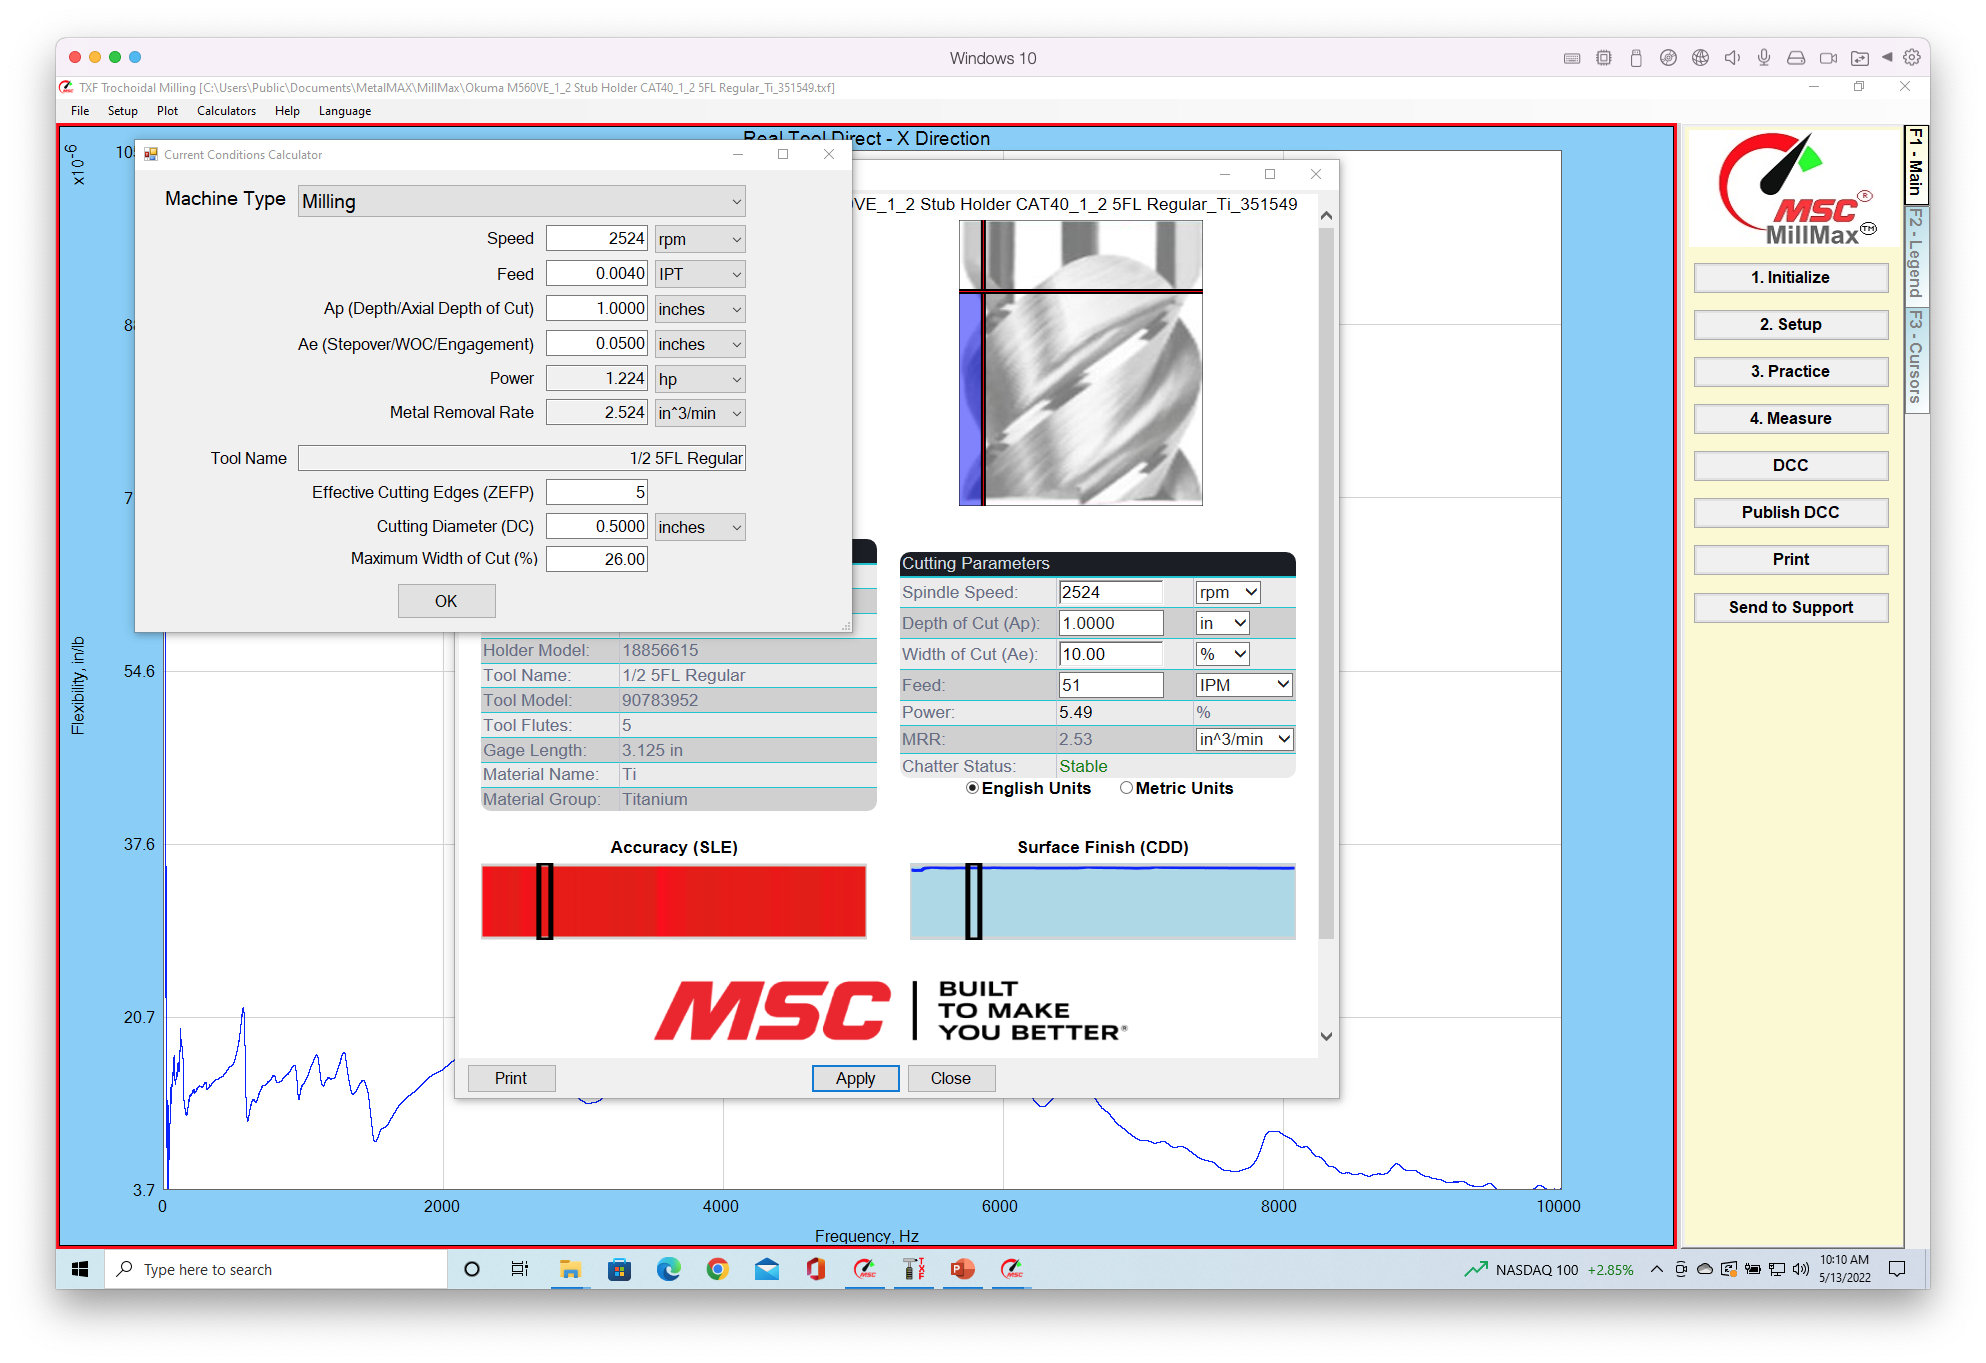
Here is how you can edit the speed, feed rate, width and depth of cut at which the Dashboard will open: 

The Dashboard will now open to the values you set in the Current Conditions.

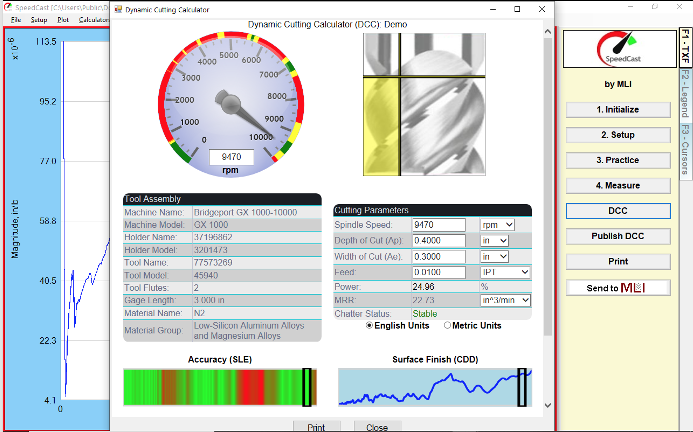
Alternatively, you can now, in DCC (not Publish DCC), adjust the Dashboard settings (speed, feed width and depth of cut), then press APPLY to save the settings.

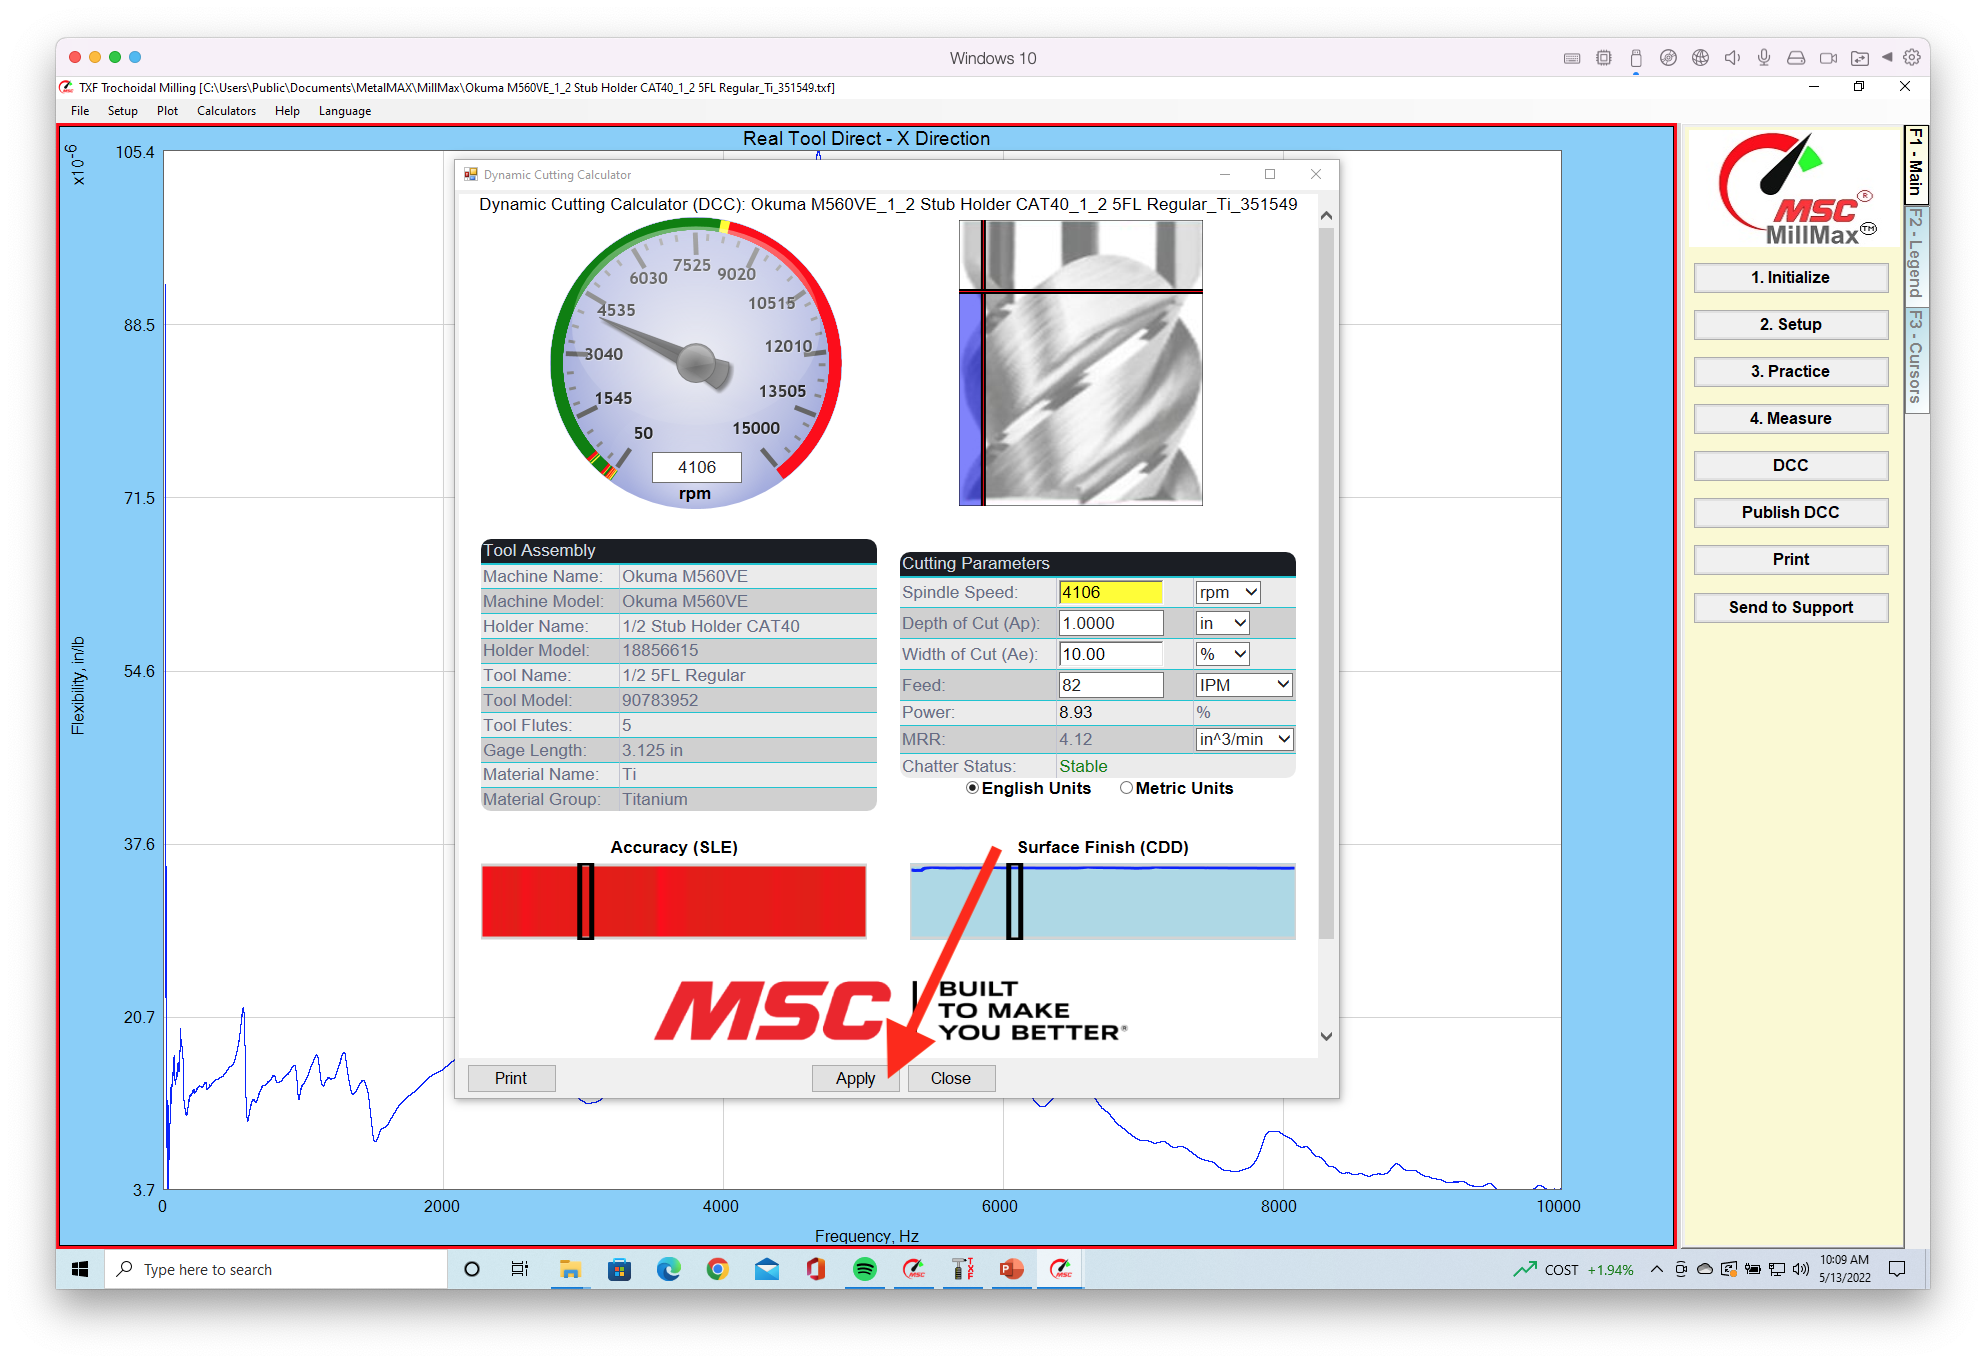
This will automatically change the CURRENT CONDITIONS fields and, after publishing the Dashboard, it will now open at these settings.