The Torque/Power Curve is often located in the operator or maintenance manual. If you don’t have one, contact your machine tool dealer or builder and get one for your model and year. If the spindle has been rebuilt, a torque/power curve will be supplied in the documents from the rebuilder. The torque/power curve gives several vital pieces of information we need to create accurate and efficient Dashboards, Max speed, torque and horsepower.

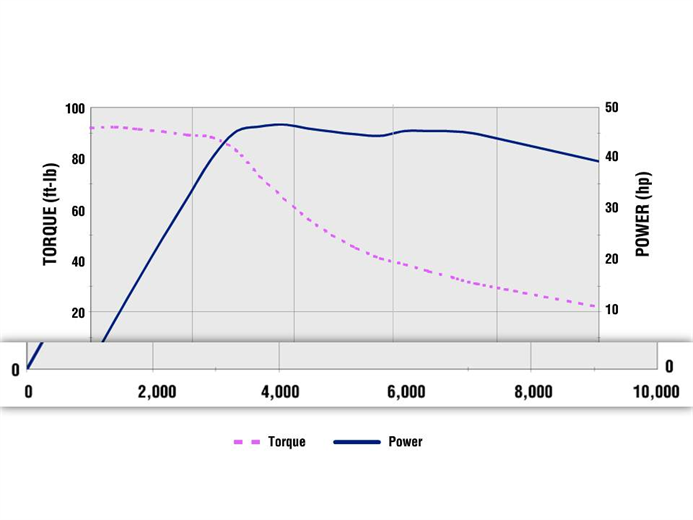
This is what a typical curve chart looks like with the RPM range on the bottom, torque values on one side, the left here, represented with the dotted line. The power on the right with the solid blue line. This chart shows foot pounds for torque and horsepower for power, but it could also use Newton meters for torque and kilowatts for power.
To add or edit a Torque/Power Curve, click on the Setup Job button in the main TXF screen.
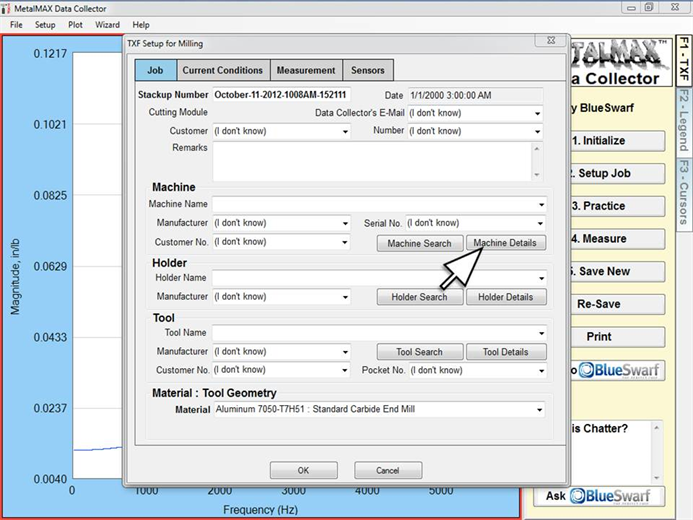
Click on Machine Details button
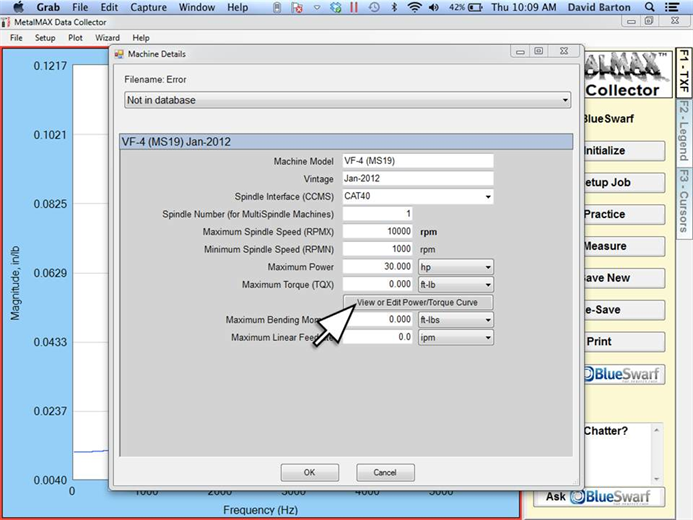
Click on the View or Edit Power/Torque Curve button.
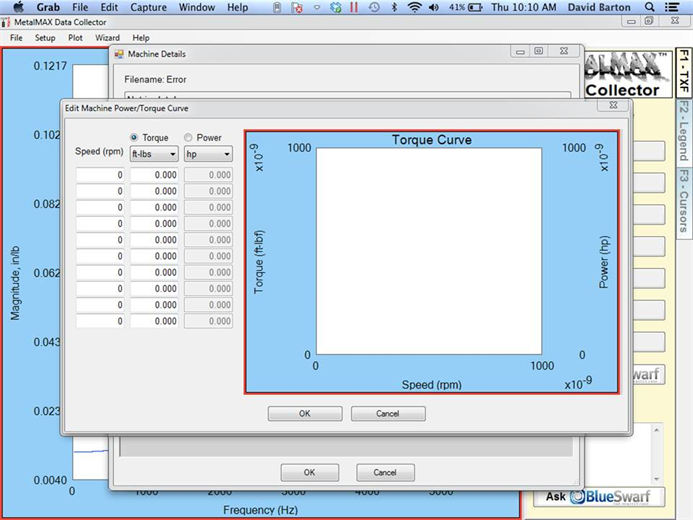
Here is the blank Torque/Power Curve entry screen.
Locate the RPM axis on the curve diagram
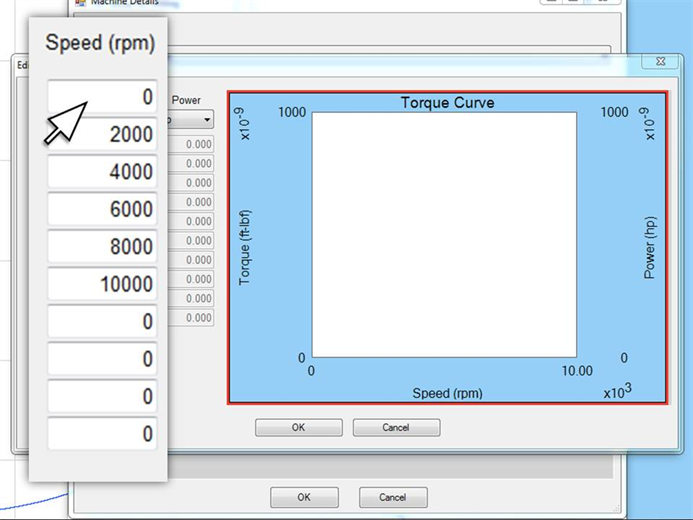
Enter those RPM splits into the first column of the DC software chart, starting with zero
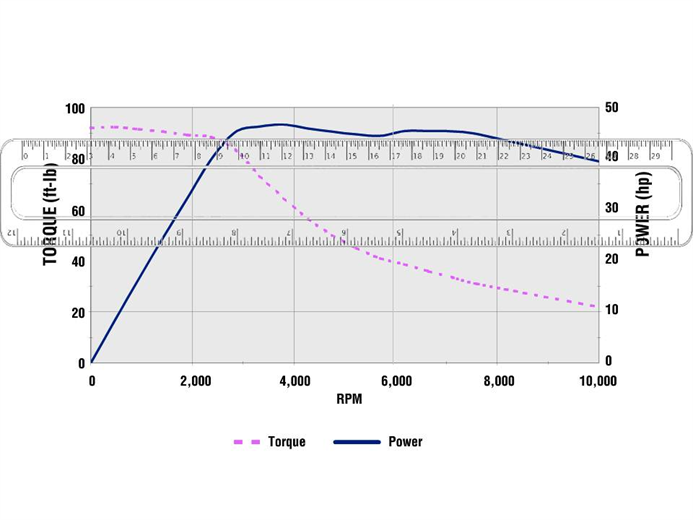
Using a straight edge or ruler locate the intersection of the torque line with each RPM split, starting at zero. The values for torque are on the left. You may have to estimate the torque value. For example in this image the ruler is set at the intersection at 2000 RPM. It appears midway between 80 and 100 foot pounds, so we estimate it to be 90 and that is what you enter into the chart. Like any curve chart, we are gathering a trend line so pinpoint accuracy of each of the actual values is not paramount.
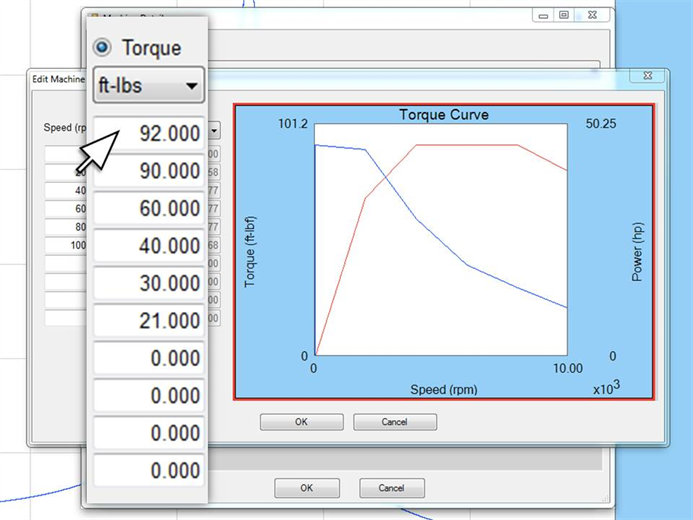
Enter the torque values at the RPM splits you have already entered starting with zero RPM. You can change the units of measure from foot pounds to newton meters.
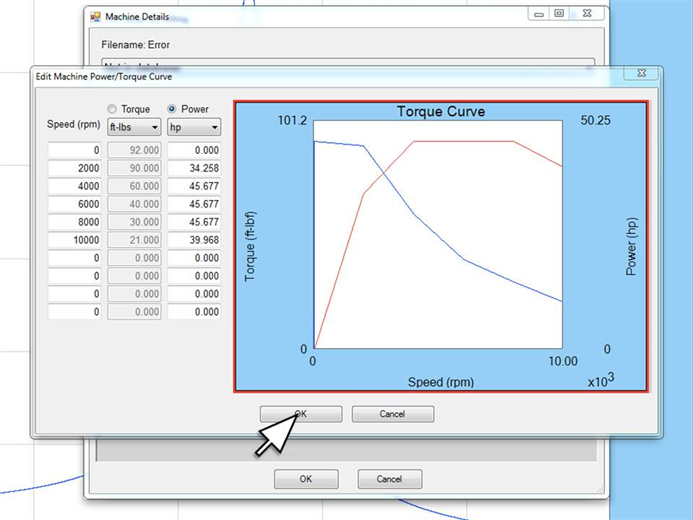
Torque is a function of power and speed, so with both the torque and speed values known, our software will automatically calculate the horsepower or kilowatts. Click OK to save.